Transform urban infrastructure management with CONTEXUS city-wide IoT platform. Visualize thousands of sensors on satellite GIS maps, monitor environmental conditions across districts, track device status in real-time, and manage smart city infrastructure from a unified command center.
Smart City Solution
Transform urban infrastructure management with CONTEXUS city-wide IoT platform. Visualize thousands of sensors on satellite GIS maps, monitor environmental conditions across districts, track device status in real-time, and manage smart city infrastructure from a unified command center.
Smart City Monitoring
Transform urban infrastructure management with CONTEXUS city-wide IoT platform. Visualize thousands of sensors on satellite GIS maps, monitor environmental conditions across districts, track device status in real-time, and manage smart city infrastructure from a unified command center.
Explore GIS Platform
Smart Solutions For Modern Problems
We specialize in offering cutting-edge tech solutions designed to tackle today's most pressing urban and environmental challenges. Join us in paving the way for a smarter, more connected tomorrow.
1000+
Devices Supported
Real-Time
Data Streaming
24/7
Urban Monitoring
City-Wide
GIS Coverage


GIS-Enabled IoT Platform
Visualize Your Entire City on One Map

Satellite View
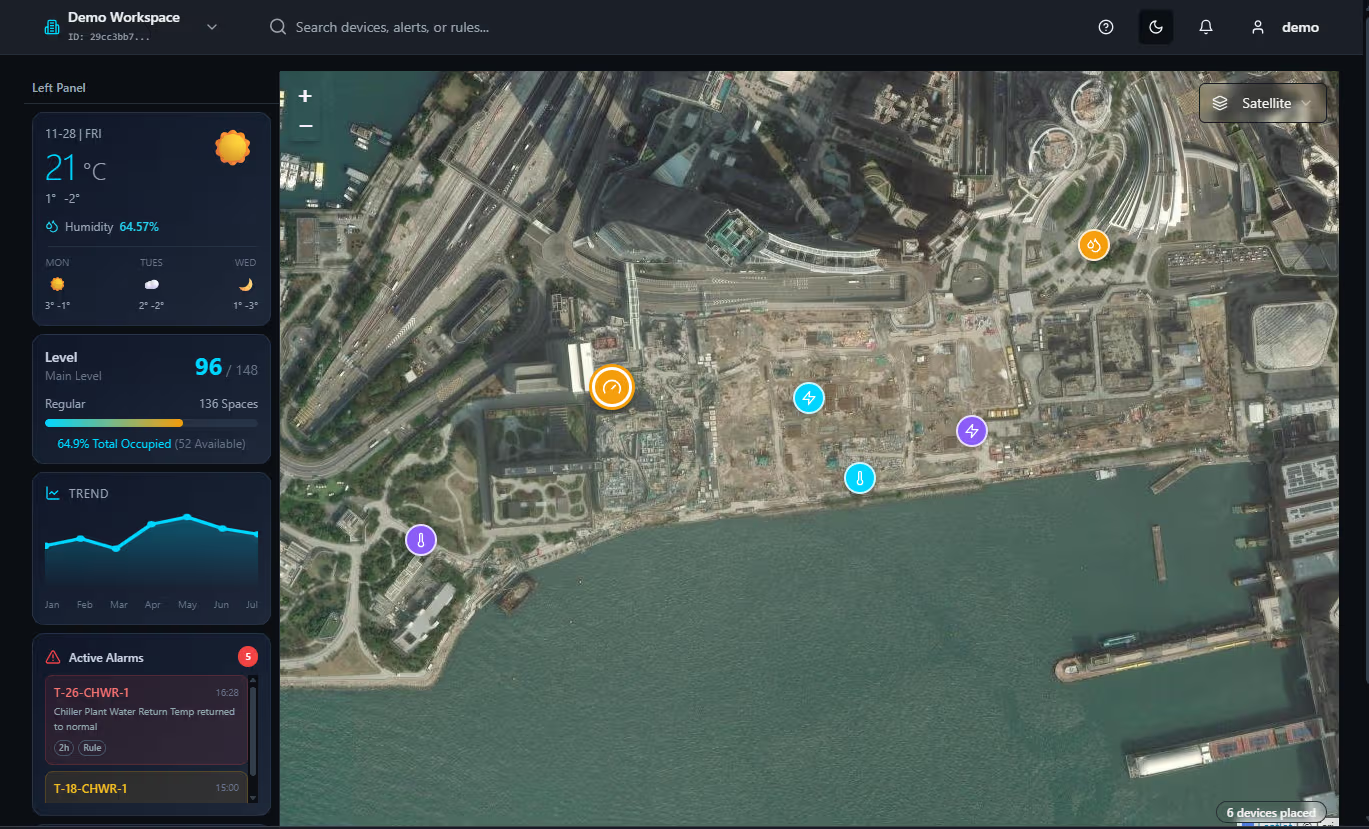
The CONTEXUS GIS Platform brings city-wide IoT infrastructure to life on satellite imagery. See every sensor, meter, and connected device positioned precisely on the map. Monitor environmental conditions, track device health, and respond to alerts—all with geographic context that makes urban management intuitive.
Multi-Layer Maps
Satellite view with high-resolution imagery covering harbors, districts, and urban zones Color-coded device icons showing status: energy meters, environmental sensors, and infrastructure Space utilization tracking: 96/148 spaces with 64.9% occupancy visibility Active alarm panel with priority alerts (T-26-CHWR-1, T-18-CHWR-1) for immediate response Weather integration showing real-time temperature (21°C), humidity (64.57%), and forecasts
Device Counter
Trend Charts
Unified City Command Center
The left panel provides weather data, level monitoring, and active alarms. The center displays your city-wide GIS map with all connected devices. Trend analysis and device counters complete your urban operations view.

Device Localization
Precise GPS positioning of all IoT devices

Real-Time Status
Live device status with color-coded indicators

Alert Center
Satellite Toggle

Supported Urban IoT Devices
Temperature

Humidity
Air Quality

Energy
Lighting

Traffic
Waste
Smart City Platform Capabilities

GIS Mapping
High-resolution satellite and street map views with seamless zoom from city-wide to individual device level. Support for multiple map layers and custom overlays.

LoRaWAN & Cellular
Multi-protocol connectivity supporting LoRaWAN, NB-IoT, LTE-M, and WiFi for city-wide sensor networks. Automatic network failover ensures reliable data collection.

Real-Time Analytics
Stream processing for instant insights across thousands of sensors. Trend analysis, anomaly detection, and predictive alerts for urban infrastructure.

Alert Management
Geo-fenced alerting with escalation paths. Route alerts to responsible departments based on location and severity. Mobile notifications for field teams.

Environmental Monitoring
Air quality (PM2.5, PM10, CO2, NOx), noise levels, temperature, humidity, and water quality monitoring across urban zones with regulatory compliance.

Smart Lighting
City-wide street lighting management with dimming schedules, motion-based activation, and energy consumption tracking per district.

Traffic & Parking
Vehicle counting, parking occupancy, and traffic flow monitoring. Integration with navigation systems for real-time guidance.

Public Safety
Surveillance camera integration, emergency response triggers, and public announcement system control for enhanced urban safety.
Smart City Applications
City-wide infrastructure monitoring across multiple districts with unified command center.

Municipal Districts
Multi-district environmental monitoring

Industrial Zones
Port, harbor, and industrial area monitoring with specialized environmental sensors.
Public Spaces
Parks, plazas, and public venues with crowd monitoring and environmental comfort.
Utility Networks
City-wide utility infrastructure including power, water, and gas network monitoring.

Transportation Hubs
Airports, transit stations, and multimodal transport centers with integrated monitoring.

Business Districts
Commercial zones with integrated building and outdoor infrastructure monitoring.

Sample Icons
All these icons are completely free for commercial use.
Business Value & ROI

Unified City-Wide Visibility
Single platform for monitoring all urban IoT infrastructure. GIS visualization provides geographic context for faster decision-making and resource allocation.
Reduced Operational Costs
Optimize maintenance routes, reduce energy consumption, and prevent infrastructure failures with predictive analytics across city assets.
Improved Environmental Compliance
Continuous air quality, noise, and water monitoring ensures regulatory compliance with automated reporting for environmental agencies.
Enhanced Public Services
Data-driven insights improve traffic flow, parking availability, waste collection efficiency, and emergency response times.
Scalable Infrastructure
Start with a district and expand city-wide. The platform scales from hundreds to thousands of devices with consistent performance.
Citizen Engagement
Public dashboards share environmental data with citizens. Improve transparency and community trust in city operations.
Smart City Monitoring is a comprehensive IoT platform that deploys sensors across urban areas and visualizes them on GIS maps.
CONTEXUS supports a wide range of urban IoT devices including environmental sensors, smart street lighting, traffic sensors, etc.
The platform is designed for scalability with support for thousands of IoT devices distributed across multiple districts.
GIS-based clustering automatically groups nearby sensors at zoom-out levels, while zoom-in reveals individual device locations.
Real-time data streaming ensures all sensor readings are current, with alert thresholds triggering notifications.
Yes, CONTEXUS integrates with existing municipal infrastructure including traffic management systems, utility networks, etc.
Standard protocols (MQTT, REST APIs, BACnet, Modbus) ensure compatibility with diverse legacy systems.
The platform provides comprehensive analytics including trend analysis across time periods and comparative district performance.
The platform provides environmental compliance reporting, energy consumption patterns, and predictive maintenance alerts.
Customizable dashboards enable different departments to focus on relevant KPIs while maintaining unified city oversight.
What is Smart City Monitoring and how does GIS visualization work?
Ready to Visualize Your City?
Experience city-wide IoT monitoring with GIS visualization. See every sensor on the map and transform how you manage urban infrastructure.
Explore Related Solutions
In this section, you can address common questions efficiently.